Global temperature trends (1880 – 2025): Climate change in animation
This video shows the change in global surface temperature compared to the 30-year-period baseline average (1880 to 1919), which is called temperature anomaly. The data include both Earth's lands and oceans.
Check also: El Niño and La Niña: how they influence global climate and heat waves (1950 to 2026)
Video speed
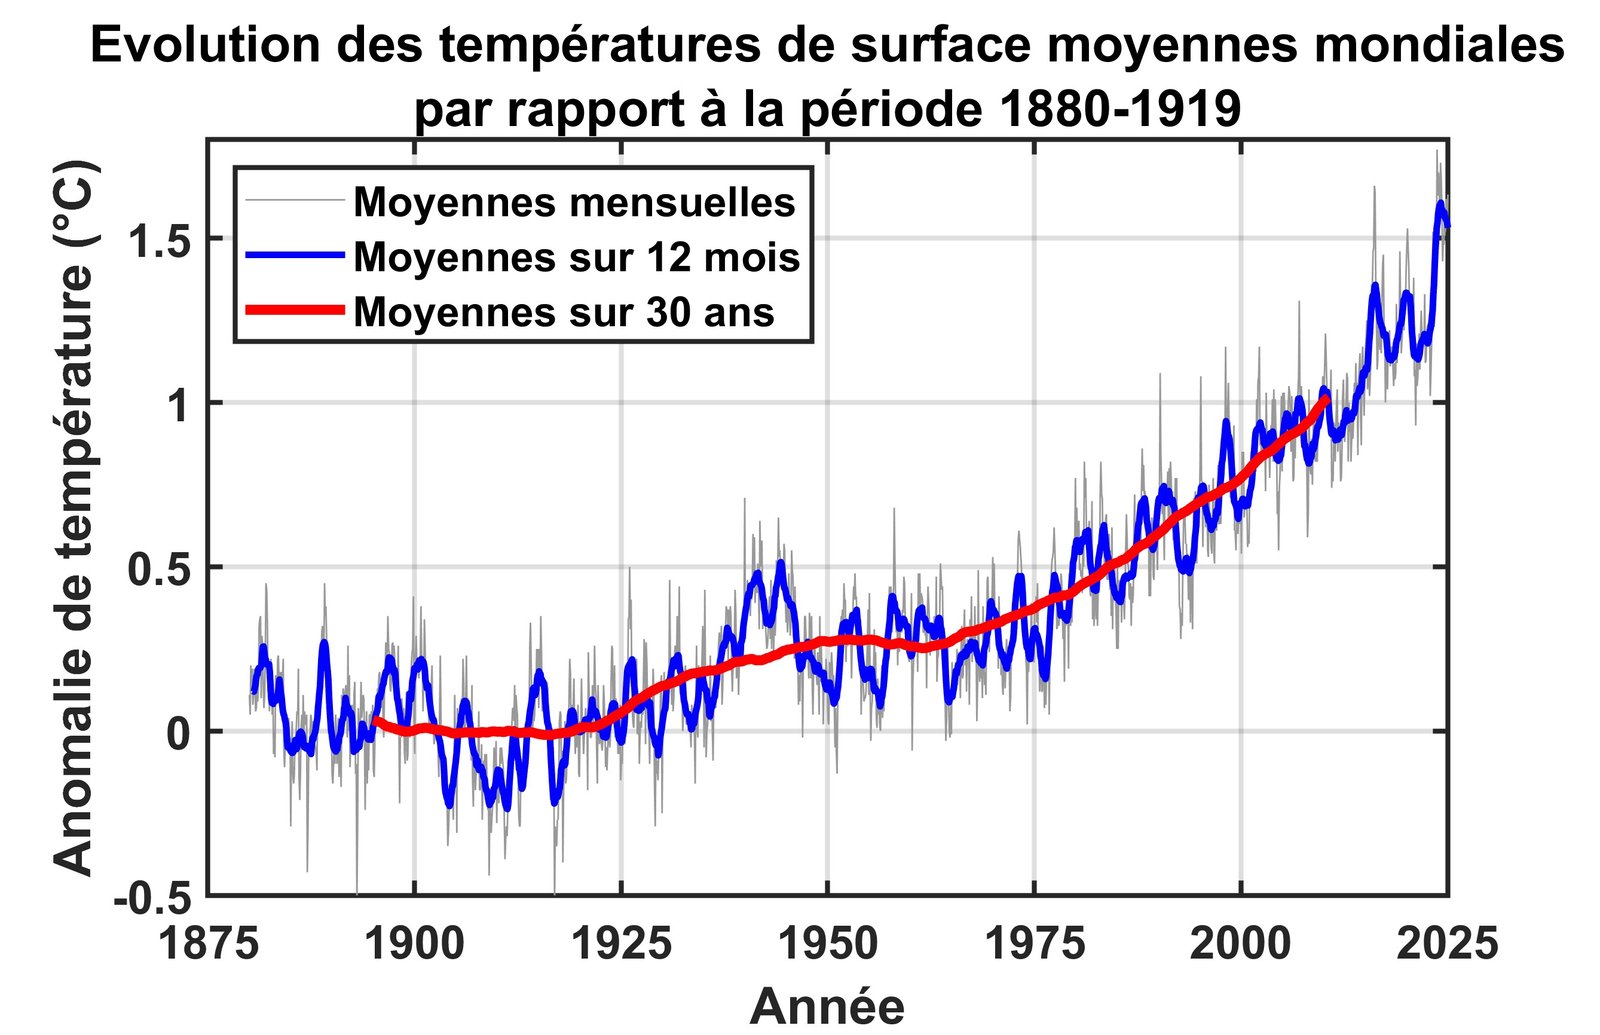
Data source: GISTEMP, 2025. Visualization: © Même Terre.