Air temperature at 2 meters (1950 to 2024)
Visualize climate change at 225 French weather stations by clicking on their locations. Air temperature has been measured since 1950, conventionally 2 meters above the surface. The graphs are based on daily minimum and maximum temperature data published by Météo-France as monthly averages.
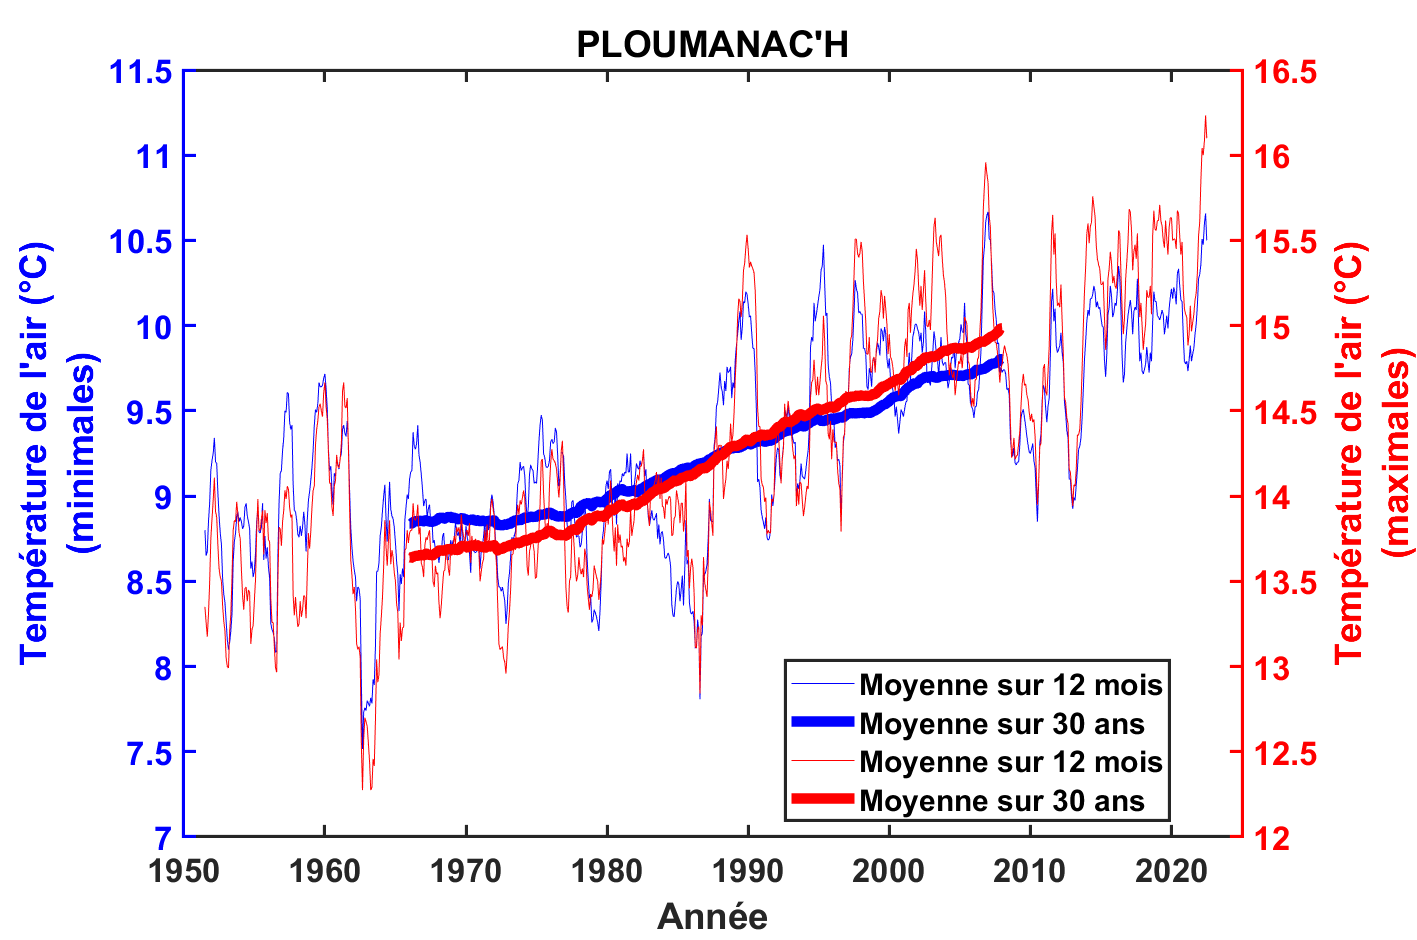
in the plot, the thin line corresponds to the 12-month average of the original data, the thick line corresponds to the 30-year average, the blue curve corresponds to the minimum temperature, and the red curve corresponds to the maximum temperature. The blue curve should be read using the blue y-axis on the left, and the red curve using the red y-axis on the right. For example, in the Ploumanac'h plot, the 30-year average minimum temperature (thick blue line) varies from 8.8 °C to 9.8 °C, and the 30-year average maximum temperature (thick red line) varies from 13.7 °C to 15 °C.
Data source: Météo-France, 2025. Visualization: © Même Terre.